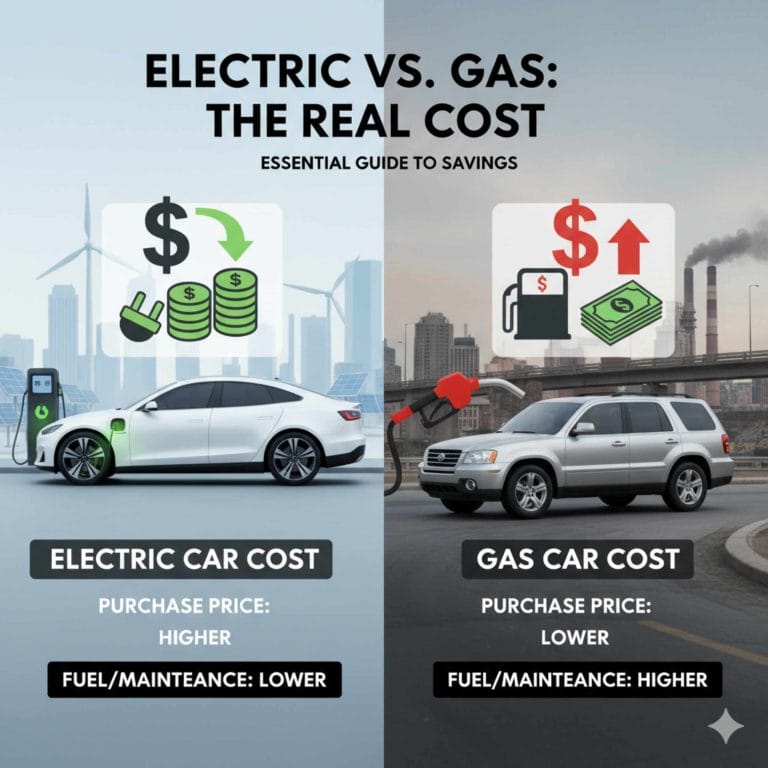

Car Comparison Guide
Use a weighted scorecard: rank your top 5 needs, give each a 1-10 weight, then score each car on price, safety, fuel use, reliability, space, tech, and annual ownership cost. I have seen cheap-looking deals turn into years of higher fuel bills, higher insurance premiums, bigger repair invoices, and worse resale. This guide gives you a use-case weighting method, side-by-side criteria, and a simple worksheet to defend the final pick.
Start with the job the car needs to do
Define the use case before you compare numbers
A Car comparison guide works better when the car has a job description. A commuter covering a long highway distance each day should usually score fuel use, seat comfort, cabin noise at speed, and driver assistance higher than third-row access. A family hauling two child seats and a stroller should weight rear-door opening, cargo shape, and safety feature availability first.
Four common use cases cover many comparisons:
- Daily commuting
- Family hauling
- Long-distance driving
- Mixed driving with occasional cargo or passengers
Set category weights before looking at scores
This is the step most comparison pages skip. If every category gets equal treatment, the result drifts toward brochure balance instead of real buyer fit.
Use several scoring buckets, such as vehicle MSRP, safety, fuel economy, reliability, space, tech, and ownership costs. Assign each a weight on a small scale, such as 1 to 10, before comparing cars. Keep the total weight visible on paper so the tradeoffs stay honest.
Choose fair comparison pairs
Compare cars that live in the same rough price band, size class, and powertrain type. A base gas sedan and a loaded hybrid SUV are usually a poor comparison, even if the monthly payment looks similar. The cleaner matchup is trim to trim, powertrain to powertrain, with destination fees and package content normalized.
how to compare two cars
Compare two cars by matching the trims, normalizing price, and scoring them against your own weighted needs instead of treating every spec equally. A practical process is to align powertrain, feature content, and out-the-door price range first, then score safety, fuel use, reliability, space, tech, and longer-term costs.
Compare trim to trim, not badge to badge
Model names hide big differences. One trim may include adaptive cruise, blind-spot monitoring, larger wheels, and a panoramic roof; another may omit some of those and affect tire cost, ride quality, and resale. A fair side-by-side starts with the trim that matches the equipment you actually need.
Normalize destination fees, packages, and dealer add-ons
Vehicle MSRP is more than base price. Include base MSRP, trim-level price spread, destination fee, and any package required to get a must-have feature. Dealer-installed accessories can distort the picture further, so separate them from factory content.
A simple check:
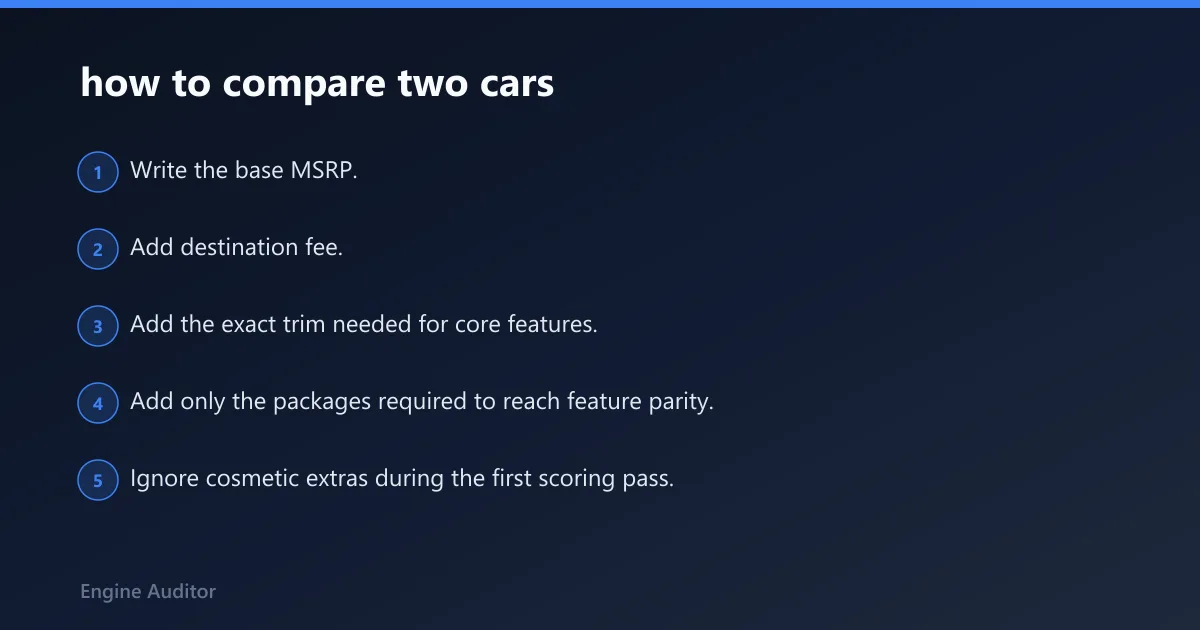
- Write the base MSRP.
- Add destination fee.
- Add the exact trim needed for core features.
- Add only the packages required to reach feature parity.
- Ignore cosmetic extras during the first scoring pass.
Separate must-have features from nice-to-have features
Must-haves belong in the comparison baseline. Nice-to-haves should be noted, then scored lightly or ignored until the final round. This keeps one flashy screen or premium audio package from overpowering safety coverage, fuel spend, or rear-seat usability.
Spot common spec-sheet traps
The usual failure case is comparing a base trim in one model with a mid or loaded trim in another. Other traps include mixing hybrid and non-hybrid versions, quoting cargo volume without checking seat position assumptions, and relying on overall safety stars while missing trim-level active safety gaps.
what should I compare between two cars
Compare transaction-ready price, safety coverage, fuel economy, reliability history, daily-use space, and five-year ownership costs before judging screens or styling. Those categories shape the ownership experience and cash flow; many brochure-friendly features matter less if the car misses your commuting, family, or highway-driving job.
MSRP and transaction-price reality
Start with vehicle MSRP, but do not stop there. A model with a lower base price can become more expensive after destination fees, trim step-ups, and option packages required to get features another model includes earlier in the range.
Track these line items:
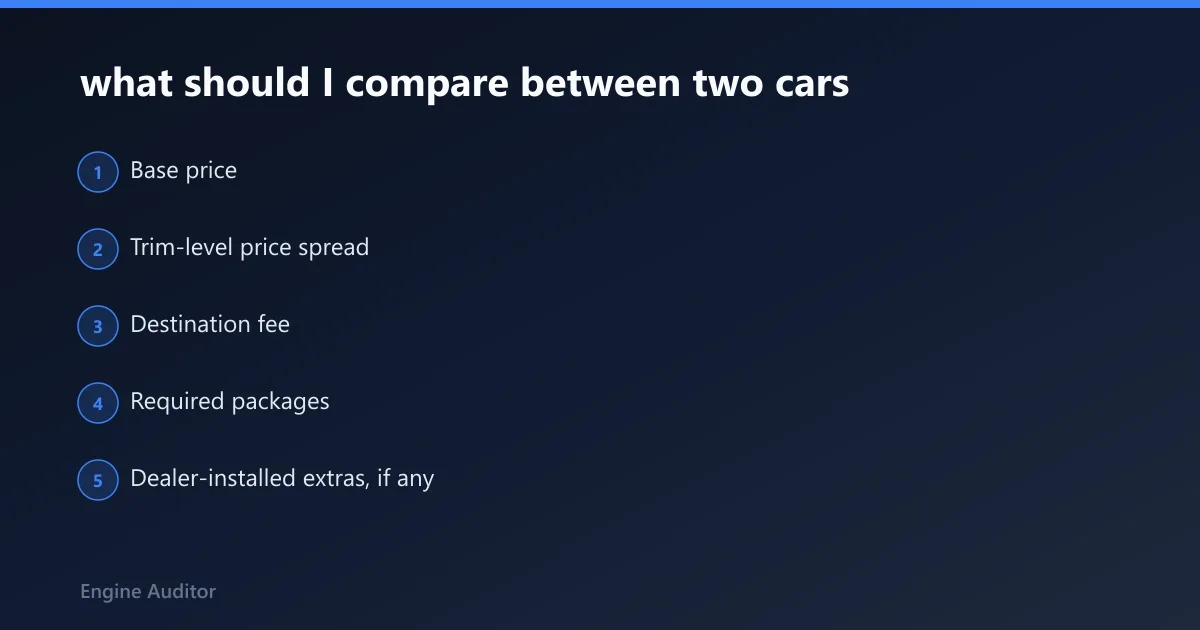
- Base price
- Trim-level price spread
- Destination fee
- Required packages
- Dealer-installed extras, if any
Safety, fuel economy, and reliability before cabin gadgets
Score IIHS and NHTSA results, trim-level active safety gear, EPA fuel ratings that match your driving mix, and model-year reliability history before infotainment and appearance. I do this first because these items drive risk and long-term cost, while a slick screen matters less than standard automatic emergency braking, solid crash results, or an engine and transmission with a clean service record.
Space, comfort, and visibility for daily use
Published dimensions help, but I never stop with the spec sheet. A cargo area can post a big cubic-foot number and still fight you with a high load floor, a narrow opening, poor stroller fit, or rear seats that do not fold flat. Rear legroom alone does not confirm child-seat fit, front-seat travel with a rear passenger aboard, or whether the rear bench cushion is supportive.
Ownership costs over five years
Total cost can combine fuel, insurance, maintenance, wear items, and depreciation. In practice, I would estimate annual fuel from your mileage and local gas prices, pull insurance quotes for the exact trims, add scheduled service plus tires and brakes, then subtract expected retained value after five years. Many comparison tools stop at fuel or finance estimates, which hides the categories that separate an easy keeper from an expensive one.
how do I compare safety ratings between cars
Compare safety by reviewing the relevant crash-test results, then checking which active safety features come on the trim you would buy. Do not rely on one overall score. Test scope, optional equipment, headlight ratings, and trim-level exceptions can change the result in a meaningful way.
Read IIHS and NHTSA with trim caveats in mind
IIHS and NHTSA measure different things and present results differently. Treat them as complementary. Look for the tested configuration, then check whether the result applies across the range or only with certain headlights, front-crash systems, or body configurations.
Check active safety equipment by trim
Standard safety equipment matters more than brochure availability. Confirm adaptive cruise, lane centering or lane-keeping support, blind-spot monitoring, rear cross-traffic alert, and automatic emergency braking on the exact trim. If one model needs a package to match another model’s standard equipment, price it that way.
Watch for body-style and equipment exceptions
One nameplate can cover a sedan, hatchback, or SUV variant with different results. Wheel size, tire choice, or headlight design can also change a test outcome or the way the car behaves in poor weather. A single model name is not proof of equal safety content.
how do I compare fuel economy across different cars
Compare city, highway, and combined fuel ratings together, then adjust for your driving mix and typical real-world variation. EPA-style combined figures are useful, but a mostly highway commuter, an urban short-trip driver, and a cold-climate owner can all see different outcomes from the same official rating.
Match the rating to your route
Highway-heavy use should weight highway fuel economy more than city. Urban driving with traffic, idling, and short trips should weight city more heavily. Mixed driving can use the combined figure as the base.
Account for real-world variance
Real use differs because of speed, weather, terrain, tire choice, load, and driving style. That does not make official ratings useless. It means they should be the baseline, with a variance note beside each car. A model with excellent official numbers but a wide real-world spread may be less predictable for budgeting.
Do not mix ratings and anecdotes blindly
Use official ratings to compare cars consistently. Use owner reports and road-test logs to estimate variance. Keep those two data types separate on the worksheet so the comparison stays clean.
how do I compare reliability before buying a car
Compare reliability by model year, powertrain, recall exposure, and owner-reported issue patterns instead of relying only on brand reputation. A strong nameplate can still have one weak engine or transmission year. The useful question is whether this exact version has recurring faults, expensive failures, or frequent service campaigns.
Use model-year data, not broad brand assumptions
Reliability should be tied to the exact year and drivetrain. Mid-cycle updates, new engines, revised transmissions, and software changes can shift the picture quickly. A used-car shopper should compare year-to-year history before comparing badges.
Look for owner-reported issue patterns
Owner reports help when they are grouped by symptom and frequency. Common categories include infotainment bugs, battery failures, oil consumption, HVAC faults, transmission behavior, and suspension wear. One isolated complaint means little; a repeated pattern deserves a score penalty.
Check recalls and powertrain history
A recall does not automatically make a car a bad buy, but repeated recall exposure across safety-critical systems should lower confidence. Powertrain history matters too. A long-running engine and transmission combination usually provides more track record than a new setup in its first model year.
Decide between new, used, and certified pre-owned based on ownership length
The single biggest factor in choosing a new, used, or certified pre-owned (CPO) vehicle is how long you plan to keep it. Buying new makes financial sense if you will drive the car for five or more years, spreading out the steep first-year depreciation while minimizing repair risk. If you intend to sell within three years, a well-inspected used car avoids that initial value drop entirely.
CPO models fill the middle ground, offering manufacturer-backed warranty coverage at a lower purchase price than new inventory. Choosing the wrong category can drain thousands through unexpected repairs, loan interest, or accelerated depreciation. A new versus used comparison breaks down total ownership costs across financing, warranty protection, and repair exposure to help you match the right option to your timeline.
how do I compare maintenance costs between car models
Compare maintenance by adding scheduled service, wear items, warranty coverage, and likely repair exposure over the period you expect to own the car. Two models with similar prices can diverge quickly when tire size, brake costs, service intervals, and parts availability start affecting real invoices.
Scheduled service and wear items
Record the expected cost and timing of oil service, fluids, filters, spark plugs where applicable, brake pads, brake rotors, and tires. Tire size alone can swing annual running cost, especially when one trim forces large wheels with pricey replacements.
Warranty coverage and repair-risk timing
Warranty length matters, but so does what is covered and when the likely repair window begins. A buyer planning to keep the car well beyond the bumper-to-bumper term should weight reliability and parts cost more heavily than a short-term lessee would.
Parts availability and repair pain points
Availability affects downtime and cost. Common wear parts for high-volume models are usually easier to source. Low-volume trims, uncommon tire sizes, and specialized components can produce longer waits and higher labor or parts prices.
how do I compare resale value when choosing a car
Compare resale by looking at depreciation rate, five-year retained value, demand for that body style, and whether the trim and options help or hurt future appeal. A car that costs more up front can still be the cheaper long-term choice if it holds value better and sells faster.
Use depreciation, not sticker shock
A lower purchase price does not always mean lower ownership cost. Depreciation is often the largest ownership expense. Estimate what each car may retain after five years, then score the expected loss rather than the headline MSRP alone.
Body style and market demand matter
Resale shifts with what used-car buyers want. In some markets, practical SUVs hold better than sedans. In others, efficient hybrids or plain mid trims with common colors move fastest. Rare configurations can help or hurt depending on demand.
Option packages do not always return their cost
Some packages help resale because they add wanted safety or comfort features. Others disappear into depreciation. Expensive cosmetic upgrades and oversized wheels often return less than buyers expect.
Compare the cabin, tech, and driving feel in a way specs miss
Space and packaging
Compare cargo volume, rear legroom, headroom, and seat comfort together. Then ask practical questions: Does the rear door open wide enough for child seats? Is the cargo floor flat? Can a tall driver sit ahead of a rear passenger comfortably? Is outward visibility good enough for daily parking?
Driver assistance features
Adaptive cruise, lane centering, blind-spot monitoring, and rear cross-traffic alert deserve their own notes. A system can be present yet limited. Some lane-centering systems work best only on clear highways. Hands-free claims, where offered, usually apply only on mapped roads and under specific conditions.
Infotainment system
Screen size is easy to list and easy to overweight. Score wireless phone integration, menu speed, voice control quality, and whether common tasks need too many taps. A smaller screen with quick responses often beats a larger screen with laggy menus.
Ride and handling
Brochure specs rarely explain steering feel, body control, road noise, or suspension tuning. During a test drive, note how the car settles over patched pavement, how much tire noise enters the cabin at 60 to 70 mph, and whether the steering feels natural in lane changes and parking-lot turns.
Use the printable weighted comparison worksheet
How the worksheet works
The worksheet below uses category weights and car scores on a simple 1-to-10 scale. Multiply weight by score for each category, then total the results. Print it, write in your trim names, and keep a note column for trim caveats such as missing safety gear, package requirements, or unusually high tire costs.
| Category | Weight | Car A score | Car A weighted | Car B score | Car B weighted |
|---|---|---|---|---|---|
| Vehicle MSRP | 8 | 8 | 64 | 6 | 48 |
| Safety | 9 | 7 | 63 | 9 | 81 |
| Fuel economy | 10 | 9 | 90 | 7 | 70 |
| Reliability | 8 | 8 | 64 | 7 | 56 |
| Space | 5 | 6 | 30 | 9 | 45 |
| Tech | 4 | 7 | 28 | 8 | 32 |
| Ownership costs | 9 | 8 | 72 | 6 | 54 |
| Total | 53 | 411 | 386 |
Worked example: commuting
For commuting, fuel economy, ownership cost, highway comfort, and driver assistance should carry more weight than cargo flexibility. In the sample worksheet above, Car A wins 411 to 386 because its better price, fuel use, and running costs outweigh Car B’s stronger space and safety scores.
This kind of result is common. A smaller or less feature-heavy car can be the better commuter if the trim includes the needed active safety equipment and keeps fuel and tire bills in check.
Worked example: family hauling
Change the weights and the winner can flip. For family hauling, try these weights: MSRP 7, safety 10, fuel economy 6, reliability 8, space 10, tech 5, ownership costs 8. Using the same car scores, Car A totals 376 and Car B totals 386.
That reversal happens because rear-seat access, cargo shape, and stronger safety content often matter more than a small fuel-cost edge. This is the point of a weighted method: the buyer decides what matters first.
Worked example: long-distance driving
For road trips, use weights such as MSRP 6, safety 9, fuel economy 8, reliability 9, space 7, tech 6, ownership costs 8. Car A then totals 381 and Car B totals 369. The gap narrows because highway safety support, comfort, reliability, and running cost all matter, while absolute cargo need drops.
Printable checklist for the worksheet margin
- Write the exact year, trim, and powertrain.
- Add destination fee to both cars.
- Price required packages for feature parity.
- Mark which safety features are standard versus optional.
- Note fuel-rating type used: city, highway, combined.
- Add reliability caveats by model year and powertrain.
- Estimate annual fuel, insurance, maintenance, and depreciation.
- Record one sentence from the test drive on seat comfort, noise, and visibility.
which car comparison site is best
No single car comparison site is best for every category. Manufacturer pages are useful for trims and package content, agency databases are better for safety, owner-report sources are better for issue patterns, and resale trackers are better for depreciation. The safest approach is to compare the same car across at least three source types.
What each source type is good for
Manufacturer pages: Trim walk, standard equipment, package dependencies, dimensions, warranty basics, and official fuel ratings.
Safety agencies and institutes: IIHS and NHTSA test results, scope notes, and equipment caveats.
Owner-report and reliability sources: Repeat issue patterns, model-year complaints, and long-term fault areas.
Resale and market trackers: Retained value estimates, demand clues, and body-style trends.
Where comparison sites can mislead
Many side-by-side tools flatten important differences. They may compare base trims only, ignore package dependencies, or display dimensions with no explanation of practical impact. Some also mix model years or present ownership estimates without clear assumptions for mileage, fuel price, or depreciation timing.
How to verify the output
Cross-check three things every time: trim content, safety feature availability, and ownership-cost assumptions. If one site says two cars are equal on safety or cost, confirm the exact trim and model year before trusting the result.
Frequently asked questions
how do I compare car specs side by side
Line up the exact year, trim, powertrain, and destination fee first, then compare price, safety equipment, fuel ratings, space, and ownership costs in one sheet. Specs alone are not enough. Add notes for package requirements, real-world fuel variance, and features that are optional on one car but standard on the other.
how do I compare safety ratings between cars
Check both IIHS and NHTSA results, then verify whether the tested equipment matches the trim you plan to buy. Pay attention to headlights, front-crash systems, and optional safety packages. A model can look strong overall while the affordable trim misses key active safety features or tested equipment.
how do I compare fuel economy across different cars
Use city, highway, and combined ratings together, then weight them according to your actual driving mix. A highway commuter should care more about highway numbers than city results. Add a note for real-world variance caused by speed, weather, terrain, tire choice, and short-trip use.
how do I compare reliability before buying a car
Look at the exact model year and powertrain, then review owner-reported issue patterns, recall exposure, and the history of the engine and transmission combination. Skip broad brand assumptions. A dependable badge can still have a weak year or one drivetrain that changes the risk completely.
how do I compare maintenance costs between car models
Build the estimate from scheduled service, tire and brake costs, warranty coverage, and likely parts availability. Larger wheels, uncommon tires, and short wear intervals can raise running costs fast. Include insurance and depreciation nearby so the maintenance view fits into a complete ownership-cost picture.
how do I compare resale value when choosing a car
Focus on expected depreciation and five-year retained value, not only the purchase price. Then factor in trim appeal, market demand, and body style. A slightly pricier car can still be the smarter buy if it holds value better, sells more easily, and avoids expensive options that buyers will not repay later.
Products related to this article
Sponsored / affiliate links. As an Amazon Associate I earn from qualifying purchases. I may earn additional commission from eligible campaigns.
 FH Group Car Seat Cover Front Set Striking Striped Car Seat Covers with Front Seat Covers and Rear Split Bench, Universal Fit Interior Accessories for Cars, Trucks, and SUVs – Gray
 4G GPS Tracker Car Anti-Theft Long Battery Life 20000mAh Real Time GPS Tracking Device Magnet No Geographic Restriction Car Tracker with Alerts, Geo Fence, History Playback TK905C
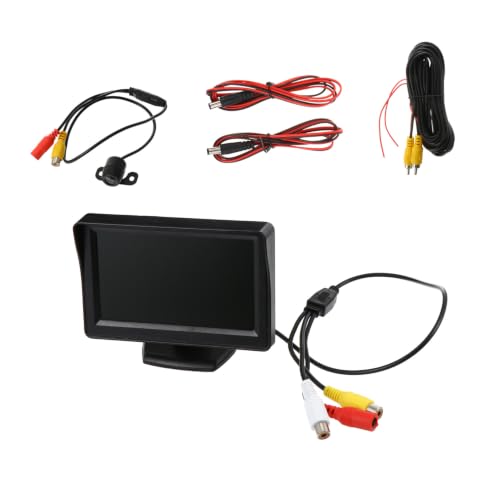 FAVOMOTO 1set Car Rear View Monitor Auto Reversing System Easy Install Backup Camera and Digital Display for Cars Suvs and Trucks and Vehicle Safety Tool