
How to Compare Maintenance Costs Between Car Models
Compare maintenance costs by matching both cars to the same ownership horizon, annual miles, and repair buckets. Then total routine service, wear items, and expected repairs, or brand averages can hide a large cost gap. A sloppy comparison can make a cheap-to-buy model expensive to own. This guide shows how to normalize costs, choose assumptions, and compare two models on equal footing.
Compare maintenance costs correctly
The cleanest comparison starts with the same time window and the same mileage. If one car is measured over about 3 years and 36,000 miles while the other is judged over about 5 years and 75,000 miles, the result is not a direct comparison. Match the horizon first, then apply the same cost buckets to both models.
Pick the same ownership window
Use one ownership period for both cars: 3 years, 5 years, or 10 years. Consumer Reports notes that warranties usually last at least three years, and the first five years often have low maintenance and repair costs. That means a new-car comparison should not be mixed with a 7-year used-car estimate unless you separate the years clearly. (Consumerreports)
Use the same mileage assumption
Mileage changes the outcome. A car driven about 10,000 miles a year will often need tires, brakes, and services on a different schedule than a car driven about 15,000 miles a year. If one model is evaluated at 30,000 miles and the other at 60,000 miles, any total will be distorted unless you convert both to a per-mile view.
Separate cost buckets before you total anything
Do not lump all spending into one maintenance number. Separate scheduled maintenance, wear items, likely repairs, and warranty or free-maintenance offsets. Repairs are not the same as routine maintenance, and warranty-covered work should not be counted as out-of-pocket spending.
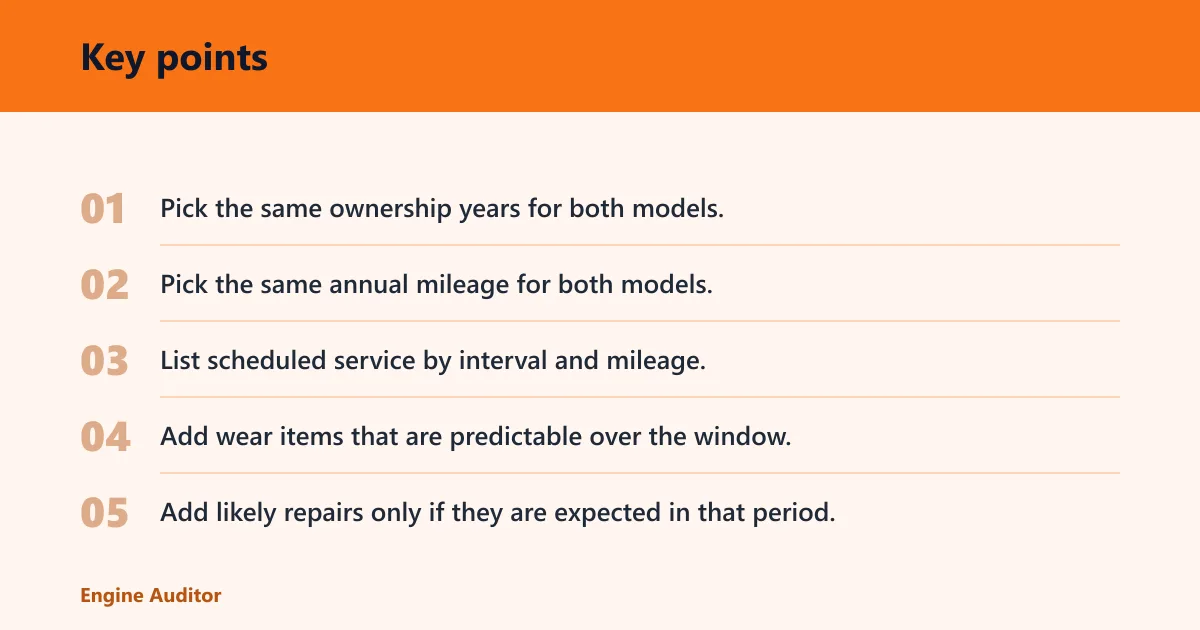
- Pick the same ownership years for both models.
- Pick the same annual mileage for both models.
- List scheduled service by interval and mileage.
- Add wear items that are predictable over the window.
- Add likely repairs only if they are expected in that period.
- Subtract warranty-covered or free-maintenance offsets separately.
- Convert the total to a per-year and per-mile figure.
What costs should you include when comparing cars?
Include the costs that are likely to hit your wallet over the chosen ownership window: scheduled maintenance, wear items, expected repairs, and any warranty or free-maintenance offsets. That structure keeps routine service separate from unexpected faults and makes two models comparable even when their maintenance patterns differ.
Scheduled maintenance
Scheduled maintenance covers oil changes, fluid changes, inspections, and other manufacturer-recommended services. Intervals vary by model, so a car that needs more frequent oil changes or extra fluid service will cost more even if the brand is usually affordable. Use the owner’s manual or model-specific service schedule, not a generic brand average.
Wear items
Wear items include tires, brakes, wiper blades, and bulbs. These parts are predictable, but many comparison charts leave them out. That omission makes a model look cheaper than it really is, especially if it uses larger tires, heavier brake components, or a more demanding brake schedule.
Likely repairs
Repairs include unexpected services such as alternators, sensors, or cooling-system work. They are separate from routine maintenance because you cannot plan them the same way as oil changes. Consumer-grade cost tools often estimate repair exposure over an ownership period, which is useful when you are comparing a simple sedan against a more complex luxury SUV or hybrid.
Warranty and free-maintenance offsets
Warranty coverage and any free-maintenance program reduce early out-of-pocket spending. Some brands include free scheduled service for the first years, which changes the total materially during the new-car period. Do not ignore those offsets, but do not extend them beyond the period they actually cover.
Ownership cost worksheet
This worksheet keeps the comparison on one page. Use the same ownership window, same mileage, and the same four rows for both models. Put the model-specific assumptions in the notes column so you can see why one car costs more without mixing the categories.
| Cost bucket | Model A total | Model B total | Per-year total | Per-mile total | Notes |
|---|---|---|---|---|---|
| Scheduled maintenance | $___ | $___ | $___ | $___ | Oil changes, fluids, inspections, interval differences |
| Wear items | $___ | $___ | $___ | $___ | Tires, brakes, wiper blades, bulbs, alignment |
| Likely repairs | $___ | $___ | $___ | $___ | Model-level repair exposure, not routine service |
| Warranty/free-maintenance offsets | -$___ | -$___ | -$___ | -$___ | Factory coverage, included service, capped periods |
| Total ownership maintenance | $___ | $___ | $___ | $___ | Use the same years and miles for both models |
For a service-cost sanity check, FixMyCar lists an average vehicle health check price of £38.53, a car diagnostic test average price of £51.66, a wheel alignment average cost of £38.83, a brake fluid change average cost of £89.92, and an air con re-gas/recharge average cost from £66.57. Those figures are not a full ownership estimate, but they help you price individual line items.
How do age bands change costs?
Maintenance usually climbs with age, but the jump is not linear. The new-car warranty period, the first five years, and years 6 to 10 behave differently. That is why a 4-year-old car and a 9-year-old car should not be judged with the same cost assumptions.
New-car warranty period
During the warranty period, many unforeseen issues are covered, so out-of-pocket repair exposure is lower. Free maintenance may also apply on some brands, which lowers the early total even more. This is the easiest period to overstate or understate if you use a generic average instead of the actual model’s coverage.
First 5 years
The same source says the first five years often have low maintenance and repair costs. That does not mean the car is cheap to maintain in every case. It means the average buyer should expect fewer big repair bills and more predictable scheduled service than in later ownership years.
Years 6 to 10
Autoblog says the average 6-10-year maintenance total is $6,311 over five years. It also reports Buick’s 6-10-year maintenance total at $4,100 and Land Rover’s at $13,900. That spread shows why model-level data matters more than a brand label alone.
A common first-timer mistake is comparing a 2-year-old compact hatchback with a 9-year-old luxury SUV and calling the higher total “the brand’s cost.” The age gap, not just the badge, is doing part of the work. Compare like with like, or split the estimate by age band.
Why model details change the bill
Two cars from the same brand can still have different service costs. Service intervals, tire size, brake wear, drivetrain complexity, and intended use all affect the bill. That is why model-level projections are more useful than broad brand averages when you are choosing between two specific vehicles.
Service interval differences
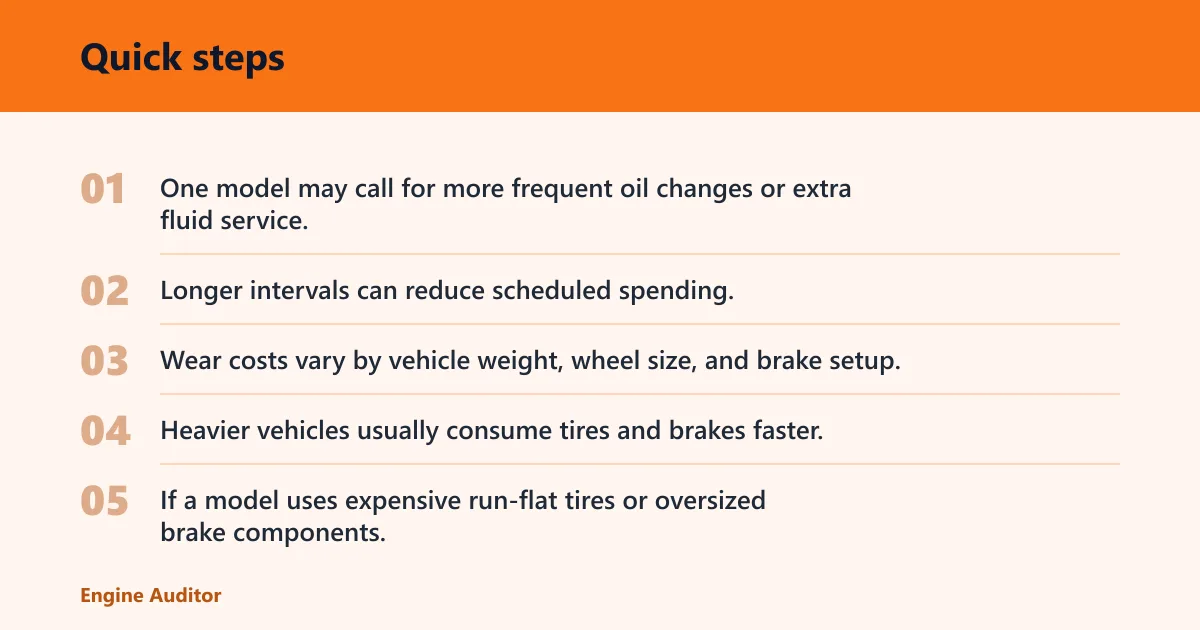
Manufacturer schedules are not identical. One model may call for more frequent oil changes or extra fluid service, while another stretches intervals farther apart. Longer intervals can reduce scheduled spending, but only if the model’s service plan actually supports them and the driving pattern fits the schedule.
Tires, brakes, and other wear items
Wear costs vary by vehicle weight, wheel size, and brake setup. Larger wheels often cost more to replace. Heavier vehicles usually consume tires and brakes faster. If a model uses expensive run-flat tires or oversized brake components, the wear-item row may be far higher than the brand average suggests.
Hybrid, luxury, diesel, and fleet-use differences
Hybrid systems add components that may change repair exposure. Luxury models often use more expensive parts and labor. Diesel-heavy models can have different fluid and emissions-service needs. Fleet-oriented vehicles may rack up high mileage quickly, which shifts the wear and repair pattern even if the model is otherwise durable.
Suppose two midsize SUVs both look similar on a listing page. One has a basic gasoline powertrain and the other is a luxury hybrid with larger tires and more complex service intervals. If both are measured over 5 years and 60,000 miles, the second car may still cost more because each bucket carries a different assumption.
Which sources are worth using?
Use sources that tie costs to a model, not just a brand. The best inputs usually come from consumer survey data, lifecycle-cost tools, and model-level maintenance projections. Brand rankings are useful for context, but they are a starting point, not the final answer.
Consumer survey data
The same source says Buick and Lincoln cost the least to own among brands studied, while European brands cost the most to own. That kind of ranking helps you set expectations before you dig into a specific model. It does not replace the model-level line items you need for an actual purchase decision.
Lifecycle-cost tools
Lifecycle-cost tools are useful because they project spending across a defined ownership window. Automotive Fleet says its Vincentric comparison covers three years or 60,000 miles. That kind of fixed horizon makes the data easier to compare if you use the same years and mileage for both models.
Model-level maintenance projections
Model-level projections matter because a specific trim, drivetrain, or use case can change the total. A compact car, a three-row SUV, and a diesel pickup may all belong to different cost patterns even within the same brand. Use the exact trim when possible.
How do warranty and free maintenance affect the comparison?
Warranty coverage lowers the early risk of unexpected repair bills, and free maintenance can remove some routine service from the first years of ownership. That changes the out-of-pocket total, especially in the new-car window. The comparison only works if you subtract those offsets only for the years they actually cover.
What warranty coverage usually changes
Warranty coverage usually covers many unforeseen issues during the first three years or longer, depending on the brand and component. That means a model with a strong warranty can look cheaper in the short term even if its long-term maintenance path is similar to a rival’s.
Where free maintenance changes the first few years
Free maintenance can remove routine service such as oil changes or inspections from the early total. That is especially important in the first 3 to 5 years, when many buyers are looking at new-car ownership. Do not count those services again if the brand already includes them.
What still stays out of pocket
Not everything is covered. Wear items still wear out, and some fluids, alignments, or accidental damage may remain your responsibility. If you leave those out, the comparison will understate the true difference between two models.
How do you compare two models side by side?
Put both models in the same table, then compare the same years, miles, and cost buckets. Show the total, the yearly figure, and the per-mile figure. Add notes for model-specific issues such as service interval differences, tire size, or warranty offsets so the result is usable, not vague.
Per-year total
The per-year figure helps when your budget is annual. Divide the ownership total by the number of years you plan to keep the car. If one model is $2,500 over 5 years and another is $4,000 over the same period, the annual gap is easy to see.
Per-mile total
The per-mile figure helps when the cars will see different use patterns. Divide total maintenance by total miles driven in the ownership window. That step matters when a commuter car and a weekend SUV are being compared under the same purchase decision.
Notes for model-specific cost drivers
Use the notes column to record why one model costs more. Maybe it has shorter service intervals, larger tires, or a weaker warranty offset. That keeps the math transparent and prevents the comparison from turning into a guess about brand reputation.
Picture a buyer choosing between a mainstream sedan and a European sedan with similar sticker prices. If both are held for 5 years and 50,000 miles, the European car may still carry higher scheduled-service and repair exposure, while the mainstream car may have lower wear-item costs. The worksheet shows the difference clearly.
Frequently asked questions
How do I compare maintenance costs between two car models?
Use the same ownership years, the same annual mileage, and the same cost buckets for both models. Total scheduled maintenance, wear items, likely repairs, and subtract any warranty or free-maintenance offsets. Then convert the result to both a per-year and per-mile figure so the comparison stays fair.
What maintenance costs should I include when comparing cars?
Include scheduled maintenance, wear items, likely repairs, and any offset from warranty or free maintenance. Scheduled service covers oil changes and fluids. Wear items cover tires, brakes, wiper blades, and bulbs. Repairs belong in a separate bucket because they are not routine maintenance.
Is a cheaper car actually cheaper to own long term?
Not always. A lower purchase price can be offset by higher service, wear, and repair costs. Long-term ownership also depends on resale value and fuel use, which should stay separate from maintenance totals. A cheap car can become expensive if its repair bucket grows fast.
How much does maintenance usually cost on a new car versus an older car?
New cars usually cost less to maintain in the first few years because warranties and free maintenance reduce early out-of-pocket spending. The same source says the first five years often have low maintenance and repair costs. Older cars usually need more repairs and more frequent wear-item replacement.
Which car brands are cheapest to maintain over time?
The same source says Buick and Lincoln cost the least to own among brands studied, while European brands cost the most to own. That is a useful starting point, not the final answer. A specific model, trim, and age band can move the result away from the brand average.
How do warranty and free maintenance affect car maintenance comparisons?
They reduce early ownership costs, especially during the first 3 to 5 years. Warranty coverage can pay for many unforeseen issues, and free maintenance can cover some scheduled service. When you compare two models, subtract those benefits only inside the period they actually apply.
What maintenance costs get missed in car comparison charts?
Wear items are often left out, especially tires, brakes, wiper blades, and bulbs. Some charts also blur repairs into maintenance or ignore model-specific service intervals. That can make a vehicle look cheaper than it really is over a 5- or 10-year ownership window.
How do I estimate annual maintenance costs for a specific model?
Start with the model’s service schedule, then add wear items based on the mileage you expect to drive. Add likely repairs from a model-level projection tool, subtract any warranty or free-maintenance offset, and divide the total by the number of years. Repeat the same method for the second model.
Products related to this article
Sponsored / affiliate links. As an Amazon Associate I earn from qualifying purchases. I may earn additional commission from eligible campaigns.