
How to Compare Car Reliability Before You Buy
Compare reliability by ranking cars on four numbers: fault rate, average repair cost, age, and mileage-adjusted warranty claims; if two models are close, choose the one with lower repair cost exposure and a stronger owner-data sample. Ignore that, and a “reliable” car can still drain you with repeat faults, long downtime, and expensive parts. This guide shows you how to compare models using survey data, age, mileage, faults, warranty cover, and repair-cost risk.
What you’ll need
- Two or more candidate models with model year or generation
- A recent owner survey or reliability ranking
- Mileage band and transmission details for each car
- Fuel type for each car: petrol, diesel, hybrid, or EV
- Warranty remaining, if any
- A repair-cost comparison worksheet
- Service history and any MOT or inspection records for used cars
How do you check a reliability rating before buying?

Start with owner-reported data, not badge reputation. A useful rating should tell you how often faults happen, how severe they are, and whether the sample is recent enough to reflect the model year you are considering. Split mechanical failures from infotainment or electrical annoyance, because they affect ownership in different ways.
Check the survey source
Owner surveys use real-driver feedback, often collected annually. Driver Power relies on thousands of UK owners’ responses and reports percentage-based scores with rank ordering. That makes it useful for comparing one model against another, but only when you keep the model year or generation in view.
Read the score with context
A score alone does not tell you whether a car has expensive faults or just irritating software glitches. Look for the fault categories behind the score, then ask whether the car’s weak points are mechanical, electronic, or trim-related. Minor infotainment complaints do not carry the same repair exposure as gearbox or cooling-system problems.
Use recency and sample size
Recent data matters because reliability can change across a facelift, software update, or production run. A large sample gives the score more weight than a thin one. If a model has a strong score but only a small or stale sample, treat it as a starting point, not a verdict.
What do reliability surveys really measure?
Reliability surveys measure owner experience, but they do not all measure the same thing. Some lean toward satisfaction, some toward mechanical dependability, and some mix the two. Read the method before comparing scores across brands, segments, or countries, because a top ranking in one market does not always translate cleanly to another.
Owner satisfaction versus mechanical dependability
Some surveys capture how happy owners are with the car overall, including comfort, controls, and features. Others focus more tightly on faults and time off the road. A car can score well on ownership satisfaction while still having a few costly faults, or score poorly because of one annoying system that never leaves the car stranded.
Why market differences matter
Country-specific surveys can produce different rankings because trim levels, engines, and standard equipment vary by market. A model sold in Britain with one powertrain mix may not match the reliability pattern seen elsewhere. When you compare results, keep the market label attached to the score.
Compare the right cars

Match like with like wherever possible. A petrol hatchback, a diesel SUV, and an EV saloon do not carry the same repair risks, running costs, or failure patterns. Compare engine, transmission, fuel type, age, and mileage band first, then use the survey score as one part of the decision.
Adjust for mileage and age
A high-mileage example should be judged differently from a low-mileage one, even if the model name is the same. Wear items age out, seals harden, batteries degrade, and software faults can appear later in life. If a car has done much more than the mileage band of the survey sample, lower your expectation of trouble-free ownership.
Keep generation and facelift timing in view
Model-year context matters because a reliable generation can hide an early bad run, and a weak generation can improve after changes. A used buyer should check whether the car is pre-facelift or updated, then compare that version specifically. Do not spread one result across every year of a model.
Use segment tradeoffs as context
The Toyota Aygo X is a city car, the Mazda CX-30 is a small SUV, and the Tesla Model 3 is a saloon EV. Those segments bring different strengths and compromises. Rear-seat space, fuel economy, charging habits, and running costs can matter as much as the raw score when two cars sit close together.
Reliability comparison worksheet
Use this table to compare one shortlist side by side. Keep the model-year context attached to the score so you do not compare a current car with an older generation by accident.
| Model | Model year | Mileage band | Transmission | Fuel type | Owner-survey score | Common fault categories | Warranty remaining | Estimated repair exposure | Final verdict |
|---|---|---|---|---|---|---|---|---|---|
| Toyota Aygo X | Mk3 (2022-date) | 0–20,000 | Manual or automatic | Petrol | 94.09% | Trim, infotainment, rear-seat space compromises | Yes, if within manufacturer cover | Low to moderate | Buy if space is enough |
| Mazda CX-30 | Mk1 (2020-date) | 20,000–40,000 | Automatic or manual | Petrol or diesel | 93.37% | Running-cost tradeoffs, braking system checks, economy variance | Check remaining cover | Low to moderate | Buy if costs fit budget |
| Tesla Model 3 | Mk1 (2019-date) | 40,000–60,000 | Single-speed EV drivetrain | Electric | 92.28% | Infotainment, software, charging-related wear | Check battery and drivetrain terms | Moderate | Buy if charging suits use |
Driver Power ranks these models highly by percentage score. The Toyota Aygo X scored 94.09% for reliability, the Mazda CX-30 scored 93.37%, and the Tesla Model 3 scored 92.28%. Those are close numbers, so the buying decision should turn on size, fuel type, warranty, and repair exposure rather than score alone.
How do you compare used car reliability between two models?
For used cars, compare the exact engine, transmission, and mileage band, then weigh warranty remaining and known fault patterns. A newer, lower-mileage car with a weaker score may still be the safer buy if the stronger rival has expensive recurring faults, little cover left, or poor parts access.
Work through the comparison in order
- Match the closest engine, transmission, and fuel type.
- Check the model year or generation and note any facelift or update.
- Place each car into a mileage band.
- Read the survey score and the fault categories behind it.
- Estimate repair exposure from the likely problem parts.
- Check remaining warranty and service evidence.
- Choose the car with the lower total risk, not the higher badge appeal.
Use a simple buy/no-buy rule
If one car shows expensive repeat faults in the same area, treat that as a larger risk than a slightly lower survey score. If both are close on reliability, choose the one with stronger warranty cover, easier parts access, and lower likely repair bills. That is usually the better used-car decision.
How much should reliability matter compared with price?
Reliability matters because breakdowns and repair bills cost real money, and in UK car-buying decisions it comes second only to price. Price still matters, but the cheapest car is not the cheapest if it needs frequent fixes, long downtime, or expensive specialist parts. Compare total ownership risk, not sticker price alone.
Fold in running costs
Include fuel economy, insurance, and road tax in the comparison. A car with a higher purchase price can still be cheaper to own if it returns better fuel economy, has modest insurance, and avoids frequent repairs. That is especially important when comparing petrol, hybrid, diesel, and EV options.
Use category scores carefully
Quality ranking, fuel-economy ranking, insurance and road tax, ride and handling, and braking performance all help separate models with similar reliability scores. The Mazda CX-30’s owners rated it first for braking responsiveness, while the Aygo X was praised for ride quality and braking performance. The Tesla Model 3 scored 100 per cent in powertrain smoothness, but infotainment and running costs still need checking.
Common mistakes
Most bad comparisons come from reading one score as if it settles everything. It does not. A strong ranking can still hide costly faults, and a weak one can be driven by minor complaints that do not affect ownership much.
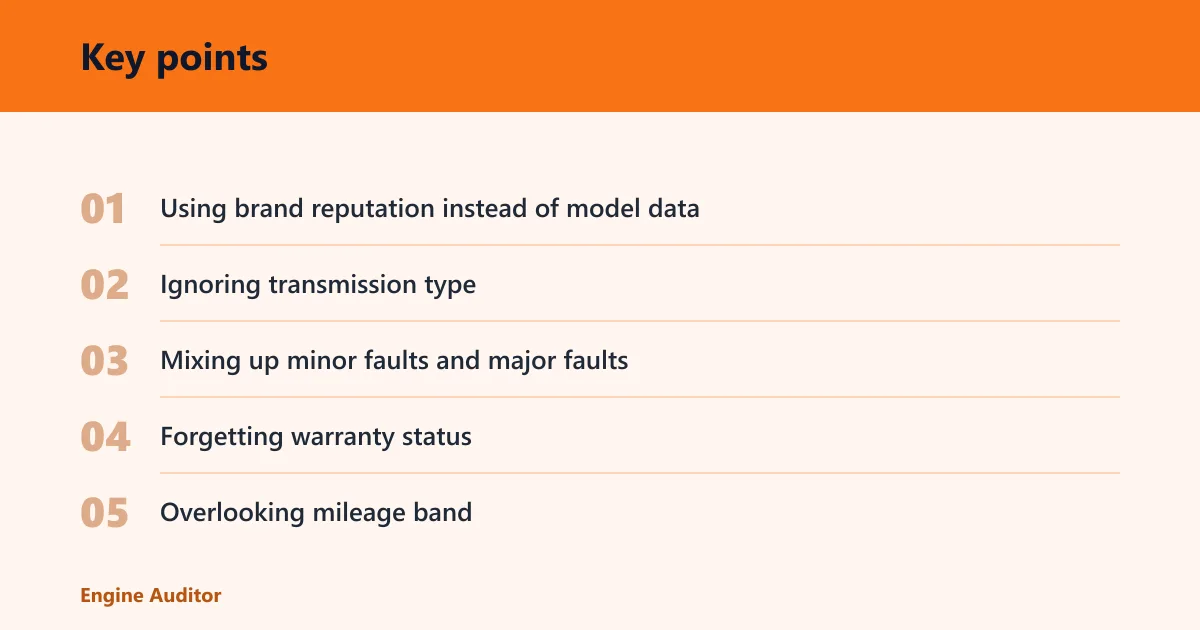
- Using brand reputation instead of model data. Compare the exact model and year.
- Ignoring transmission type. Some faults sit in the gearbox, not the engine.
- Mixing up minor faults and major faults. Screen glitches are not the same as drivetrain failures.
- Forgetting warranty status. Remaining cover can change the risk balance fast.
- Overlooking mileage band. Wear-related problems rise with age and use.
Say your shortlist is a petrol hatchback and a small SUV with similar scores. If the hatchback has a history of cheap trim faults and the SUV has a known gearbox issue, the SUV can be the worse buy even if it scores slightly higher overall. The likely repair bill matters more than the headline number.
Suppose you are choosing between the Mazda CX-30 and the Tesla Model 3. The Mazda has the stronger braking-feedback reputation, while the Tesla’s powertrain is praised for smoothness. If your route depends on easy charging and you are comfortable with EV software and infotainment checks, the Model 3 can still make sense; if not, the Mazda may be the lower-risk ownership fit.
How can you tell if a car has expensive common faults?
Look for faults that hit the drivetrain, battery, electronics, cooling, steering, brakes, or transmission, not just interior trim. Expensive faults usually repeat across multiple owner reports and appear in the same area of the car. If the same component keeps showing up, treat it as repair exposure, not an isolated complaint.
Check the pattern, not the anecdote
A single owner story means little. Three or more recurring reports in the same fault area deserve attention, especially if they mention the same age, engine, or transmission. A used buyer should also ask whether the problem is covered by warranty, recall, or known service campaign.
Look for clues in the listing and paperwork
Missing service history, repeated repairs, warning lights, and short test-drive warnings are all useful clues. If a seller cannot explain a common issue clearly, walk away or price in the repair risk. Cheap parts and easy access can soften the blow, but they do not erase a bad fault pattern.
Frequently asked questions
How do I check a car reliability rating before buying?
Look for a model-specific owner survey that reports fault frequency, fault severity, and sample size. Then check the model year or generation, because a score from one run of the car may not fit another. Read the complaint categories before you decide.
What is the most reliable car brand right now?
There is no safe answer that fits every model in a brand. Use model-level results instead, because a strong brand can still have weak engines, gearboxes, or infotainment systems in one car line. Compare the exact car, not the badge.
Are reliability ratings from Consumer Reports worth trusting?
They are useful if you treat them as one input, not the final answer. Check what the survey measures, how recent the data is, and whether the market matches your own. Do not mix satisfaction scores with mechanical-fault data without checking the method.
How do I compare reliability on electric, hybrid, and gas cars?
Use the same worksheet, but change the fault checks. For EVs, focus on software, charging, battery cover, and infotainment. For hybrids, add battery and hybrid-system checks. For petrol and diesel cars, weigh gearbox, fuel-system, and emissions-related faults alongside the owner score.
Products related to this article
Sponsored / affiliate links. As an Amazon Associate I earn from qualifying purchases. I may earn additional commission from eligible campaigns.