How to Read an EV Battery Range Estimate
Treat the dashboard range number as a weather-adjusted guess, not a battery-health test: compare it with the car’s rated range only after charging to a similar state of charge in similar temperatures, and worry mainly if the estimate stays about 10 to 15% low in matching conditions. Read it wrong, and a healthy battery can look worn out, or real degradation can hide until it costs you range. This guide shows how to separate usable energy, weather-driven range swings, and signs of abnormal battery aging.
What the range number actually means


The number on the dash changes with driving history, temperature, HVAC use, and the battery’s current usable energy. A low reading after a cold week does not mean the pack suddenly shrank.
Dashboard estimate vs EPA rating
The EPA range estimate is an official certification metric based on standardized test procedures. It helps you compare vehicles on the same basis, but it is not the same as real-world range because temperature, speed, HVAC load, and terrain all change energy use. (EPA)
That is why EPA, WLTP, and CLTC numbers should not be mixed as if they were interchangeable. Use the right certification number for the market, then compare it with your own driving pattern and weather.
Why state of charge is not the same as range
State of charge, or SOC, is the displayed battery percentage. It is not a universal physical empty point, and many EVs keep a hidden reserve near 0% to protect the pack and avoid true zero-energy operation.
Range and SOC can move in different directions. Two cars at 50% SOC can show very different miles remaining if one has been driven at highway speed in cold weather and the other has spent the last hour in city traffic.
How EV range is calculated
EV range is calculated from usable battery capacity and trip efficiency. In simple terms, the car estimates how many kilowatt-hours you can actually use, then divides that by how much energy your driving pattern consumes per mile or per kilometer.
Usable battery capacity in kWh
Usable battery capacity is the driver-accessible energy, measured in kWh. It is different from gross battery capacity because software buffers keep some energy hidden at the top and bottom of the pack. Those buffers help protect the battery and can make usable capacity smaller than the pack’s full chemical size.
That matters for range math. A battery may still be healthy even if the dashboard shows less available energy than a new-car brochure implied, because the car never lets you use every last bit of the pack.
Trip efficiency in mi/kWh or kWh/100 km
Trip efficiency is the key conversion factor. If the car uses about 3.0 mi/kWh, each usable kilowatt-hour should carry it about 3 miles under those conditions. If the display uses kWh/100 km, lower numbers are better, because fewer kilowatt-hours are needed to cover 100 kilometers.
Wheelhome says the car’s range prediction is based on recent driving, and that the dash range can be optimistic. That is why a calculator or trip computer is only as good as the inputs you feed it.
The simple range formula
Use this check: expected range = usable kWh × efficiency. If the car has about 54 kWh usable and your recent efficiency is about 3.2 mi/kWh, the expected range is about 173 miles under similar conditions. Change the efficiency, and the answer changes fast.
For a plug-in hybrid example, Kia said the Sportage PHEV had a target electric-only range of 32 miles, a 7.2 kW onboard charger, a 13.8 kWh battery capacity, and could recharge in 2 hours on a Level 2 charger. Those figures show how range, charging speed, and usable energy are related without being identical numbers.
Why the estimate changes in real driving
The display changes because conditions change. Cold weather, HVAC use, speed, hills, traffic, and wind all alter trip efficiency, so the range number should be read as a live estimate rather than a promise.
Temperature and HVAC load
Cold weather usually lowers range because batteries give up energy less efficiently when cold, and cabin heat can draw heavily from the pack. Summer can also cut range if the vehicle spends energy on cooling or if heat raises resistance in the pack and drivetrain.
Battery thermal management matters here. Liquid-cooled packs generally control temperature more tightly than air-cooled packs, which can help limit heat-related degradation and make seasonal behavior more predictable. Air-cooled systems can show sharper swings in hot or cold weather.
Speed, traffic, hills, and wind
High speed raises aerodynamic drag. Hills add load, stop-and-go traffic can help or hurt depending on regenerative braking, and headwinds can chew through range faster than many drivers expect. None of that means the battery has suddenly failed.
Say your EV shows 240 miles after a full charge on a mild day, then 195 miles after a cold night with the cabin heater on high. That drop can be normal weather-driven range loss, not evidence of degradation, if charging state and route type changed at the same time.
Why winter trips often read lower
Winter trips often produce the lowest range estimates because the car learns from recent efficiency. Short cold trips with heat on can drag the displayed number down, and repeated top-up charging can keep the estimate conservative or, in some systems, temporarily optimistic after a few gentle drives.
A common first-timer mistake is treating that drift as a battery-health verdict. It is often just the car recalculating from the last few drives.
Range estimate decoder
This table turns one dashboard number into three checks: usable energy right now, the driving conditions behind the estimate, and whether the result points to normal drift or a possible issue. The values below are example interpretations, not universal limits.
| Displayed range | Usable kWh | Expected mi/kWh | Likely cause | What to check next |
|---|---|---|---|---|
| 200 mi | 60 kWh | 3.3 | Mild weather, steady driving, normal learning | Confirm with the trip computer after a full charge on the same route |
| 165 mi | 55 kWh | 3.0 | Cold weather and cabin heat | Compare with a similar temperature, not with a summer commute |
| 140 mi | 50 kWh | 2.8 | Driving style, high speed, hills | Check recent highway use, tire pressure, and wind exposure |
| 125 mi | 50 kWh | 2.5 | Repeated short cold trips or conservative guess-o-meter learning | Reset expectations after a few mixed drives and check for a trend |
| 125 mi | 44 kWh | 2.8 | Likely degradation or a reduced usable buffer | Look for a capacity report, service scan, or warranty screening data |
When low range means battery aging
Battery degradation is the loss of ability to hold a charge over time. It comes from calendar aging and cyclic aging, and it usually reduces usable capacity gradually rather than causing one dramatic failure.
Calendar aging versus cycle aging
Calendar aging happens with time, even if the car is driven lightly. Cycle aging comes from charging and discharging the pack repeatedly. Climate, mileage, storage habits, and charging pattern all influence how fast that loss appears.
JouleIO notes that most modern EV batteries last 10 to 20 years and are typically about 100,000 to 200,000 miles. It also cites the US federal battery warranty as 8 years/100,000 miles, with estimated replacement costs of $8,000 to $15,000.
What thermal management changes over time
Battery thermal management affects how heat stress is handled over the pack’s life. Liquid-cooled systems often manage heat better in summer fast charging and heavy driving, while air-cooled packs may show faster temperature swings that can influence long-term wear.
That does not mean every air-cooled car is a bad buy. It means you should ask more carefully about climate history, charging habits, and the car’s actual usable capacity.
How charging habits affect wear
DC fast charging can accelerate wear in some use cases, but usage share matters. A car that fast-charges occasionally on road trips is not the same as one that relies on DC fast charging every day. Level 2 charging is the common baseline for home and public AC charging, and it usually fits normal ownership patterns better.
Suppose a used EV has spent most of its life on Level 2 charging, lived in a mild climate, and still shows a range estimate close to the EPA figure after a full charge. That pattern points more toward normal aging than a battery problem.
Battery-health warning signs table
Use dashboard symptoms as clues, not verdicts. A single low number is weak evidence. Repeated low readings in similar conditions carry more weight, especially when paired with capacity data or a seller’s service report.
| Dashboard symptom | Likely interpretation |
|---|---|
| Range drops after cold nights, then returns in mild weather | Normal temperature effect |
| Range changes after a few days of highway commuting | Normal trip-efficiency drift |
| Range stays 10–15% low in the same temperature after repeated full charges | Possible capacity loss or a poorly calibrated estimate |
| Range estimate jumps after several gentle drives | Software learning or guess-o-meter correction |
| SOC falls normally but the range display collapses much faster than expected | Check for weather load, tire pressure, or battery-health data |
Used-EV range checks and warranty thresholds
For used-EV screening, low range is normal aging when it lines up with age, mileage, climate, and charging history. It becomes a red flag when the car is still inside the warranty window yet shows a persistent capacity gap that cannot be explained by weather or recent driving.
How to judge 70% capacity claims
Many buyers use about 70% capacity as a practical warning line because warranty coverage is often written around a similar threshold, though terms vary by brand. Do not treat that as a universal rule. It is a decision check, not a law of physics.
The same source notes that the US federal battery warranty is 8 years/100,000 miles, and Wheelhome says the battery cover typically runs to eight years or a set mileage. If a seller says the pack is “fine,” ask for the evidence behind that statement.
What to ask before buying a used EV
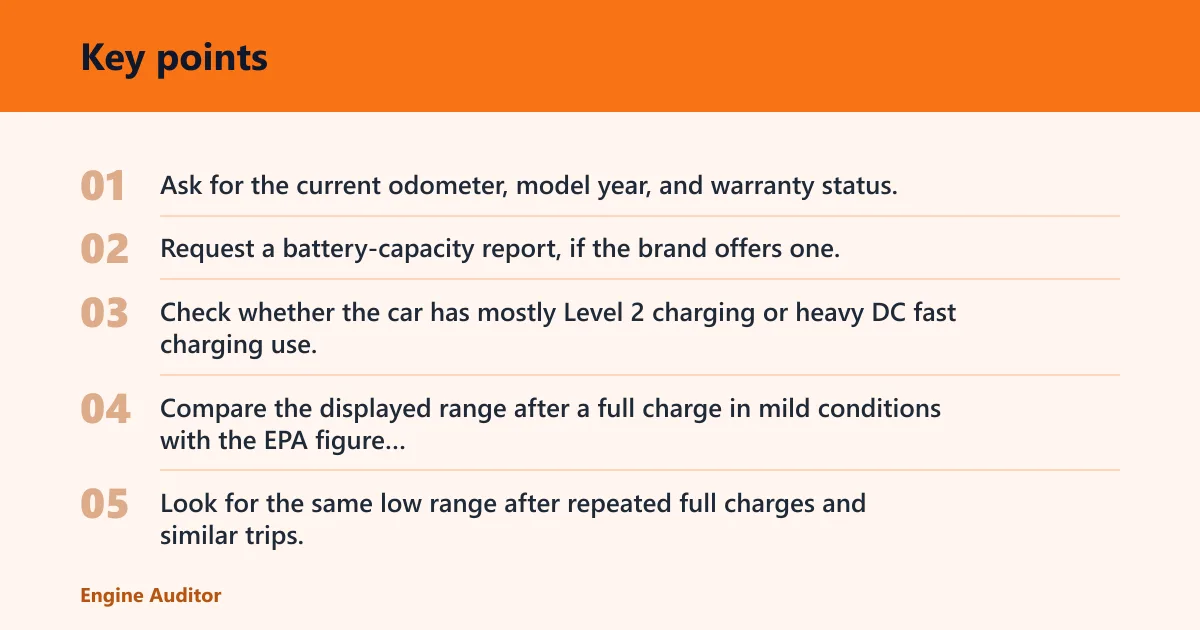
- Ask for the current odometer, model year, and warranty status.
- Request a battery-capacity report, if the brand offers one.
- Check whether the car has mostly Level 2 charging or heavy DC fast charging use.
- Compare the displayed range after a full charge in mild conditions with the EPA figure for that model.
- Look for the same low range after repeated full charges and similar trips, not after one cold morning.
How much does an EV battery cost? Replacement cost is often far higher than a routine service item, and JouleIO gives estimated replacement costs of $8,000 to $15,000. How much is an EV battery? The answer depends on model, labor, and whether the pack can be repaired, but the point is the same: verify health before you buy.
How much for an EV battery check? That depends on the brand and whether a dealer scan, third-party report, or capacity test is needed. The useful question is not the cheapest check, but the one that tells you whether the pack’s usable capacity is still within a normal band for that car.
Frequently asked questions
How is EV range calculated?
EV range is calculated by dividing usable battery energy by driving efficiency. If you know the usable kWh and your recent mi/kWh or kWh/100 km, you can estimate range for your current conditions. The dashboard does a similar calculation, but it updates from recent driving and temperature.
How do I read an EV battery range estimate?
Read it as a short-term forecast, not a battery-health score. Compare it with the car’s rated range only after similar charging, similar temperature, and similar route type. If it stays about 10–15% low in matching conditions, that deserves a closer look.
What is the average EV range?
There is no single average that fits every EV, because car type, pack size, and certification cycle differ. A compact commuter EV, a long-range crossover, and a performance sedan will not land in the same band. Use the rated range for the exact model, then test it against your commute.
How do I calculate electricity cost for an EV?
Take the kWh you add to the battery, then multiply by your electricity rate. If you know the car’s efficiency, you can also estimate cost per mile by dividing the price per kWh by miles per kWh. Charging losses and time-of-use pricing can change the final bill.
Products related to this article
Sponsored / affiliate links. As an Amazon Associate I earn from qualifying purchases. I may earn additional commission from eligible campaigns.