Car Depreciation Calculator: How to Use It Correctly
A car depreciation calculator estimates what a vehicle may be worth now and later by combining purchase price, age, mileage, condition, trim, and market data. A common rule of thumb is about 20% lost in the first year, then roughly 15% to 25% annually after that. Mix that up with loan balance or tax depreciation, and you can overpay, go underwater on a loan, or misread your resale position. This guide shows how to use the calculator, which inputs matter, and how to separate market value from financing and book value.
How is this calculated?
Press Calculate to see the math with your numbers.
What a car depreciation calculator shows
A car depreciation calculator estimates resale value, not a promise. It starts with the purchase price, then cuts that figure for age, mileage, condition, and market setting. The useful output is usually current value or a future value at a chosen ownership point, often 1 to 10 years.
Depreciation versus resale value
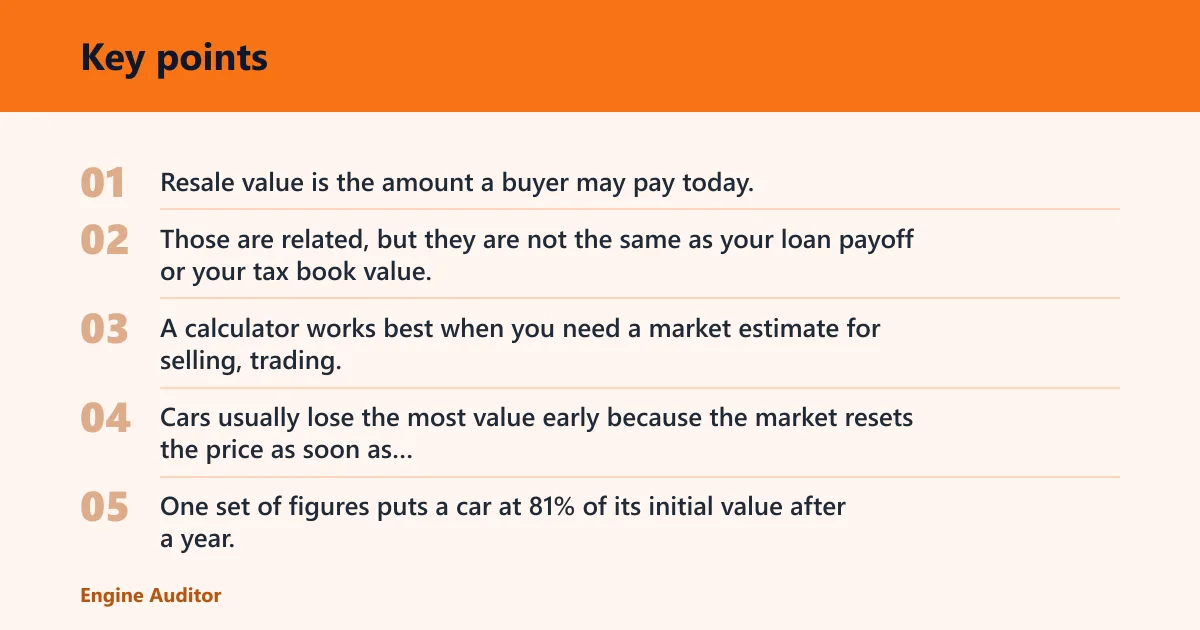
Depreciation is the loss in value. Resale value is the amount a buyer may pay today. Those are related, but they are not the same as your loan payoff or your tax book value. A calculator works best when you need a market estimate for selling, trading, or planning ownership cost.
Why cars lose value fastest early
Cars usually lose the most value early because the market resets the price as soon as they become used. One set of figures puts a car at 81% of its initial value after a year, and another shows a typical new car in the United States at about 79.98% retained value after one year. A new car can lose 10% to 15% of its value immediately, and another says a new car can be worth 25% less by the end of the first year.
The difference between estimate and appraisal
An estimate is model-based. An appraisal is car-specific. If the car has unusual damage, a rare trim, or local demand swings, the calculator can drift away from a dealer offer or lender figure. Use the estimate to plan, then verify with a trade-in quote, private-sale comps, or a lender payoff statement when the decision matters.
Car depreciation inputs
The main inputs are purchase price, age or ownership period, mileage, condition, make and model, and the market or country. A good calculator treats these as a starting value plus modifiers. If one input is wrong, the result can look tidy and still miss the real resale range.
Purchase price and starting value
The initial car value is the base for the calculation. A calculator usually assumes depreciation begins from the amount paid, whether that was sticker price or the actual transaction price. A lower purchase price can soften the loss in dollars, even if the percentage decline is similar.
Age, mileage, and ownership period
Ownership period sets the horizon. The common planning window is 1 to 10 years. A short hold can hide early value loss, while a longer hold exposes slower but still meaningful decline. Mileage then pushes the number down further if the car is driven heavily.
Make, model, condition, and market
Brand and model matter because retention differs widely. Condition matters because repairs, tire wear, interior wear, and cosmetic damage affect what a buyer will pay. Market or country matters because fuel prices, import taxes, supply shortages, and local demand can move the resale range in either direction.
How the calculator estimates value loss
Most calculators use a non-linear curve, not a straight line. The first year is usually the steepest. Later years soften, though the slope can change again when a model is refreshed, a big repair shows up, or market demand shifts. A 10-year schedule is often more realistic than a flat yearly deduction.
Annual depreciation rate
The depreciation rate is the yearly percentage value loss. A common five-year retained value for new cars is about 50% to 60% of the original price, but the site data also shows a five-year retained value around 39.74% on one table and about 40% after five years on another. That gap is a reminder that different calculators use different assumptions.
Retention curve over 1 to 10 years
The calculator’s curve is front-loaded. Value decreases to 81% after a year, to 40% after five years, and to zero after approximately 10.5 years. That is useful for planning, but it is still a model. A car in strong condition or a hot segment can hold better than that path suggests.
Where mileage and accidents change the curve
Mileage and accident history bend the curve downward. High mileage can move a car into a weaker resale band, while a clean history can keep it near the upper end of the range. Minor damage usually hurts less than moderate or major damage, but buyer trust can fall hard even when the repair is sound.
Depreciation scenarios table
This table shows how the same calculator output can mean different things. The resale range is market value. Loan balance risk is whether the vehicle may be worth less than what is still owed. Tax or book depreciation is a separate accounting result for business use.
| Scenario | Purchase price | Years owned | Mileage | Accident history | Estimated resale range | Loan balance risk | Market or tax/book depreciation |
|---|---|---|---|---|---|---|---|
| New compact sedan, clean record | $30,000 | 1 | 12,000 | None | $24,000 to $25,500 | Low if down payment was 20% or more | Market depreciation |
| Five-year mainstream sedan, normal use | $28,000 | 5 | 60,000 | None | $11,000 to $16,000 | Moderate if the loan term was 72 months | Market depreciation |
| Luxury sedan, higher mileage | $60,000 | 3 | 48,000 | Minor repaired damage | $30,000 to $36,000 | High if financed with little down | Market depreciation |
| Electric SUV, low mileage, market shock | $55,000 | 2 | 18,000 | None | $34,000 to $42,000 | Moderate if incentives changed after purchase | Market depreciation |
| Business van, company use | $40,000 | 4 | 80,000 | Moderate damage repaired | $14,000 to $21,000 | Often high until principal is paid down | Tax/book depreciation |
| Fleet car in a tax ledger | $35,000 | 1 | 20,000 | None | $26,000 to $29,000 | Depends on financing; separate from book value | Tax/book depreciation |
Does mileage affect depreciation?
Yes. Mileage affects car depreciation because every extra mile adds wear, shortens remaining life in the eyes of buyers, and can move the car into a weaker resale bracket. The effect is not perfectly linear. Thresholds matter, and high-mileage cars usually lose more value than low-mileage cars with similar age and condition.
Annual miles and value loss
Annual mileage is one of the strongest inputs after age. A car driven far above the expected mileage for its age usually sees a larger value haircut than a similar car with average use. The difference becomes more visible after several years, when buyers start comparing maintenance risk and expected repair timing.
High-mileage penalties
A high-mileage penalty often appears as a lower resale band rather than a single fixed deduction. Say your car is five years old with 90,000 miles instead of 50,000. The calculator may still show a plausible average value, but the actual market offer can fall because buyers discount future repairs, tire wear, and suspension wear.
When low mileage helps less than condition
Low mileage helps, but it does not rescue a poor condition car. A common first-timer mistake is to focus on odometer miles and ignore accident repairs, stale tires, worn brakes, or a rough interior. Buyers often compare total condition first, then mileage second.
How make, model, and market change results
Make and model shape the curve because some vehicles keep demand longer than others. The site lists Toyota at 58% five-year retention, Honda at 56%, BMW at 42%, and Tesla at 48%. Those figures are useful as examples, not universal rules. Refresh cycles, fuel costs, and local supply can move any one model off its usual track.
Brand retention differences
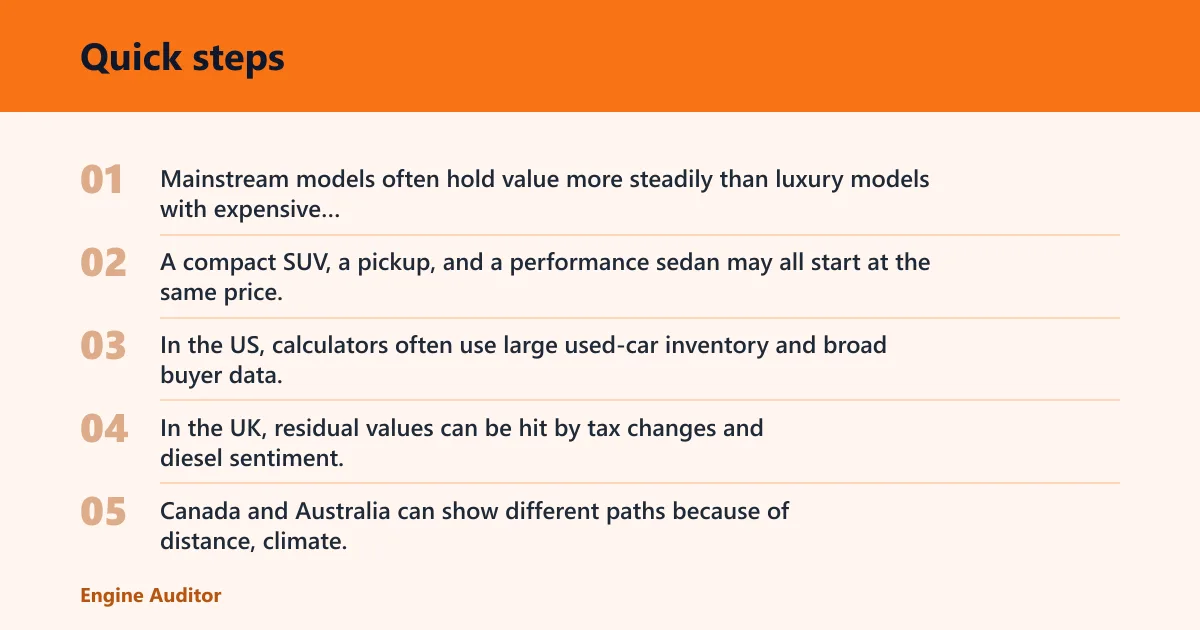
Retention varies by segment. Mainstream models often hold value more steadily than luxury models with expensive repair paths. A compact SUV, a pickup, and a performance sedan may all start at the same price, yet reach very different resale points because buyers weigh operating cost and long-term reliability differently.
Country-specific depreciation assumptions
Country matters. In the US, calculators often use large used-car inventory and broad buyer data. In the UK, residual values can be hit by tax changes and diesel sentiment. Canada and Australia can show different paths because of distance, climate, and import constraints. India, Singapore, and the UAE each add their own demand patterns, registration costs, and market filters.
Model refreshes, demand shifts, and market shocks
Depreciation is not smooth when a model gets refreshed or replaced. A redesign can drop the prior version faster than the standard curve predicts. Fuel prices, government incentives, import rules, and sudden changes in electric vehicle demand can also move values quickly. That is why a calculator should be read as a range, not a promise.
Picture a three-year-old hatchback in Singapore with moderate mileage and clean history. The calculator may still use a broad retained-value curve, but the local certificate, demand pool, and ownership cost can change the resale number much more than the same car would in the US.
When to trust the calculator
Trust the calculator when you want a planning estimate for resale, trade-in timing, or ownership cost. Do not trust it alone when the car has a loan balance, unusual damage, business use, or a market shock. That is when you need a lender payoff, dealer appraisal, or tax schedule instead of a generic market curve.
Reliable use cases
The calculator is reliable for a clean-title car with normal mileage, ordinary wear, and a mainstream model. It is also useful for comparing ownership windows, such as selling after three years versus five years. If the inputs are close to reality, the result is good enough for planning and negotiation.
When to switch to a dealer quote or lender payoff
Switch tools when the remaining loan matters. Loan payments and loan payoff are separate from value loss, and a car can be worth less than the balance owed. If that happens, the calculator still shows market depreciation, but the real decision depends on whether you are underwater and how fast principal is falling.
Checklist for resale, insurance, and tax use
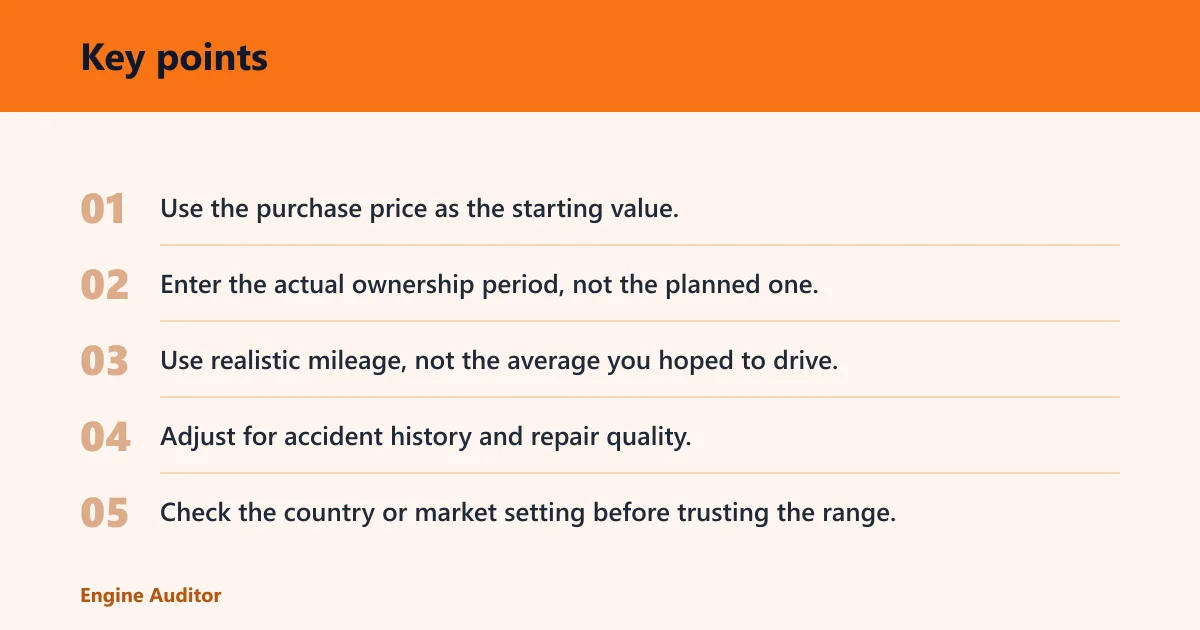
- Use the purchase price as the starting value.
- Enter the actual ownership period, not the planned one.
- Use realistic mileage, not the average you hoped to drive.
- Adjust for accident history and repair quality.
- Check the country or market setting before trusting the range.
- Compare the result with loan payoff only if financing is still active.
- Use tax or book depreciation only for business records, not resale.
For insurance, the relevant number is usually claim valuation or replacement cost, which may differ from market resale value. For taxes, business vehicles can use MACRS, Section 179, or bonus depreciation rules, but those rules measure accounting recovery, not what a buyer will pay. That separation matters.
Frequently asked questions
What is a car depreciation calculator?
It is a tool that estimates how much value a car may lose over time based on price, age, mileage, condition, model, and local market data. The result is a resale estimate, not a loan payoff figure and not a tax schedule. Use it for planning, then confirm with real market quotes.
How do I calculate the depreciation value of a car?
Start with the purchase price, then apply a value-loss curve for each year owned. A common estimate is about 20% lost in the first year, then 15% to 25% annually after that, with mileage and condition changing the result. Many calculators simply automate that sequence.
How much car depreciation should I expect over 5 years?
A common five-year retained value for new cars is about 50% to 60% of the original price. Some published examples are lower, including about 40% after five years and about 39.74% on another table. The spread shows why model, mileage, and market conditions matter.
Does mileage affect car depreciation?
Yes. Higher mileage usually lowers resale value because buyers expect more wear and more maintenance risk. The penalty is often stronger once the car moves past common mileage thresholds for its age. Low mileage helps most when the rest of the car is also clean and well maintained.
How does vehicle depreciation get calculated?
Most calculators use a non-linear retention curve rather than a flat yearly cut. One source puts a car at 81% after a year, 40% after five years, and near zero after approximately 10.5 years. Mileage, accidents, model demand, and local market conditions then adjust that curve.
Should I use a car loan or depreciation calculator first?
Use the depreciation calculator first if your goal is resale planning. Use the loan payoff next if you still owe money. Those are different numbers. The first tells you what the car may be worth; the second tells you what you still owe the lender.
How does car depreciation differ by make and model?
Retention varies by brand and by specific model. The site lists Toyota at 58% five-year retention, Honda at 56%, BMW at 42%, and Tesla at 48%. Those figures are examples of brand differences, not guarantees for every trim, market, or condition level.
What is a good depreciation rate for a car in Singapore?
There is no single good rate because Singapore pricing is shaped by local ownership costs, registration rules, and demand. A calculator there should be read with local assumptions, not US averages. The right comparison is the local resale market for the same age, mileage, and trim.
Can I use car depreciation for taxes or insurance?
Only if you separate the purpose. Market depreciation estimates resale value. Tax or book depreciation is for business accounting and may use MACRS, Section 179, or bonus depreciation rules. Insurance claim values may also differ because insurers price replacement, settlement, or actual cash value under their own terms.
Products related to this article
Sponsored / affiliate links. As an Amazon Associate I earn from qualifying purchases. I may earn additional commission from eligible campaigns.
 4G GPS Tracker Car Anti-Theft Long Battery Life 20000mAh Real Time GPS Tracking Device Magnet No Geographic Restriction Car Tracker with Alerts, Geo Fence, History Playback TK905C
 Car Scratch Repair Wax, 2026 New Scratch Remover for Vehicles – Universal Polishing Paste for Deep Scratches & Various Surfaces, with Wipe & Sponge (1)